
This post originally appeared on the iEmergent blog.
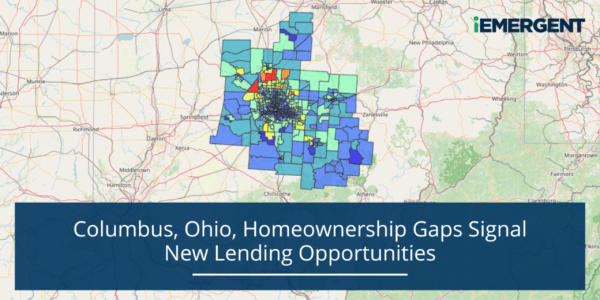
Fast-growing Midwest hub Columbus, Ohio, is birthplace of the Oreo cookie, home to the largest Pride celebration in the region, and a magnet for immigrants drawn to historic neighborhoods like German Village, Italian Village, and Hungarian Village. Yet alongside this vibrancy, Columbus also contends with historic racial homeownership gaps that limit wealth-building and stability for communities of color.
Today, those long-standing gaps are beginning to narrow through initiatives like CONVERGENCE Columbus, a multi-year, cross-sector initiative launched by the Mortgage Bankers Association and housed at the Affordable Housing Alliance of Central Ohio. The effort brings together lenders, housing advocates, nonprofits, and public agencies to co-create community-driven, data-informed solutions to systemic barriers in housing.
How have initiatives to date made an impact in Columbus, where do mortgage lending opportunities lie, and how can lenders in this market use data to grow business while continuing to work toward closing the homeownership gap? Read on to find out.
Demographics in Columbus
The United States is far from a uniform mortgage market. It’s made up of more than 84,400 census tracts, 925 core-based statistical areas (CBSAs), and over 390 metropolitan statistical areas (MSAs), and because each is unique, we forecast mortgage opportunity at the census-tract level. That allows lenders to use local data to make localized decisions. Since 2010, iEmergent’s forecast has outperformed most models designed to predict U.S. mortgage originations, maintaining an accuracy rate of over 90%.
The Columbus MSA is the most populous area in Ohio, with a population of 2.14 million people in 855,000 households, and its population has grown faster than most of its midwestern peer cities over the past two decades. The overall homeownership rate is 61.3%, median household income is $88,330, and there is a 30.9% minority population.
The region is home to five Fortune 500 and 16 Fortune 1000 companies, with notable brands including Nationwide, Huntington National Bank, DSW, Express, Wendy’s, and Big Lots. Not surprising, then, that 46% of area jobs are classified as “management, business, science, and arts” by the U.S. Census Bureau.
These characteristics shape not only who lives in Columbus today, but also the scale and direction of its future housing demand. Understanding this local landscape is essential for interpreting where lending activity is headed next and what opportunities may emerge for lenders.
A Look Ahead at Columbus Lending
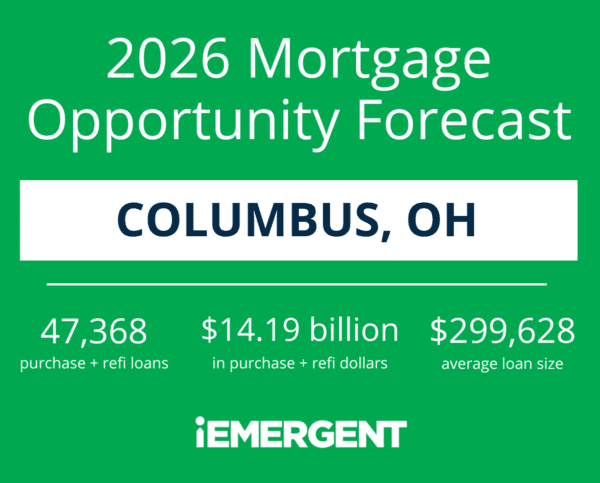
In Columbus, our 2026 projections call for 47,368 combined purchase and refinance loans, amounting to $14.19 billion in volume with an average loan size of $299,628.
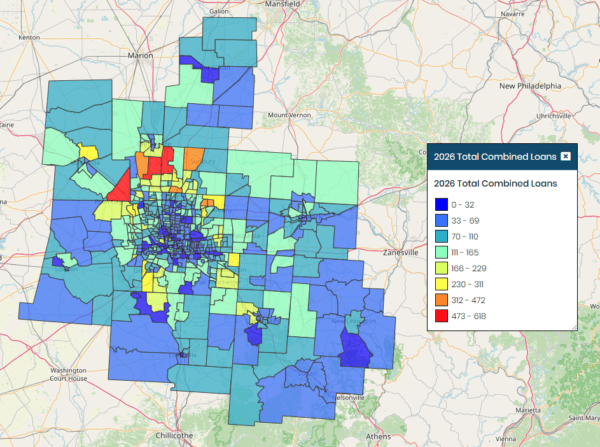
When we plot that forecast by census tract, you can see that more loans will originate away from the urban core, specifically to the northwest.
Who’s Doing the Lending?
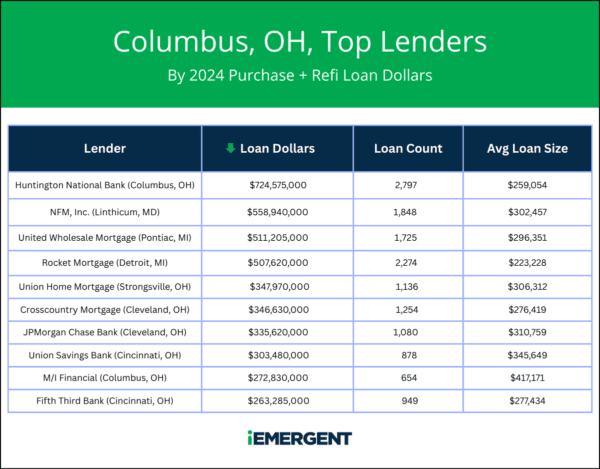
Locally based Huntington National Bank led the MSA for combined purchase and refi loan dollars in 2024.
When we look at loan count instead of dollars, nine of the top 10 lenders stay on the list, with a slight shift in order.
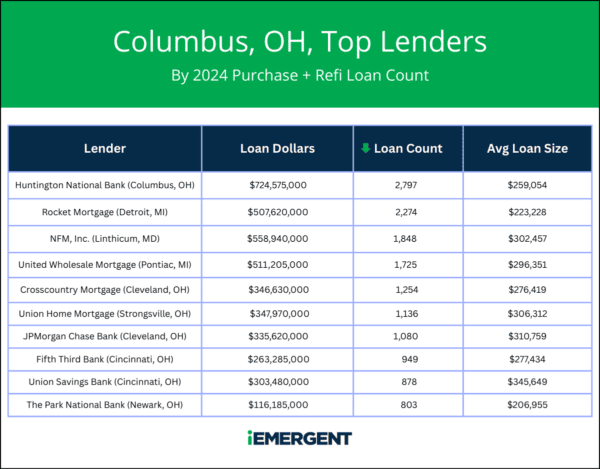
Unlike many markets we analyze, lenders based in the state took a majority of the top spots for both loan dollars and loan count.
Fast Market Growth, Then Easing
From 2023 to 2027, total dollar volume for purchase and refinance originations in Columbus are forecast to grow from $9.4 billion to $14.6 billion, a 54.2% increase. The increase can be attributed to 14,200 more loans and a $25,000 increase in average loan size over that same period.
This growth, however, is expected to flatten over the longer term. From 2026 to 2031, the Columbus market is expected to grow at a slower rate than the U.S. as a whole.
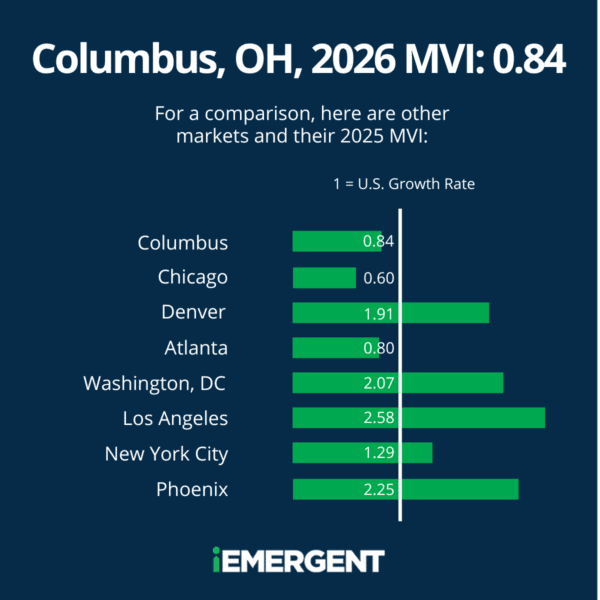
iEmergent’s Mortgage Velocity Index (MVI) compares a market’s rate of growth in loans over the next five years to the growth rate of the overall U.S. market. An MVI of 1 means a market is growing on pace with national market growth, and Columbus has a 0.84 MVI.
Racial Disparities Signal Opportunity
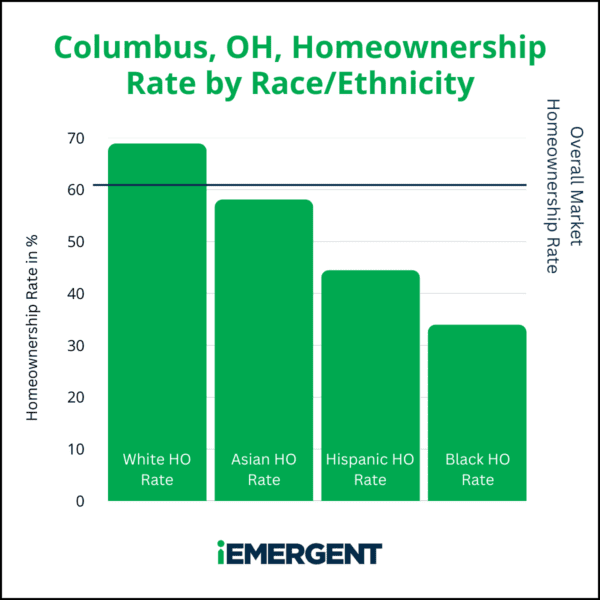
In the Columbus MSA, 30.9% of the population (and 26.7% of households) are from racial/ethnic minority groups. Homeownership gaps for these groups are large, with the non-Hispanic white homeownership rate (68.9%) about double that of Black households (34.0%).
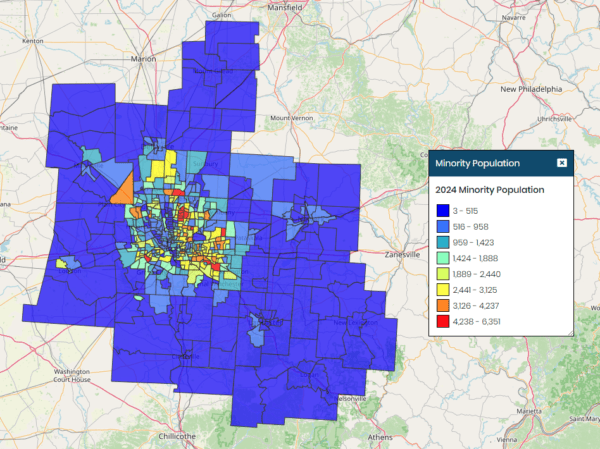
The minority population in Columbus is highly concentrated in the city center, creating a compelling case for place-based custom credit programs tailored to meet the needs of these communities.
A JPMorganChase analysis found that the price gap between lower- and higher-income areas is bigger in Columbus than in similar Ohio cities and the U.S. overall, especially in the dense city center where minority populations live.
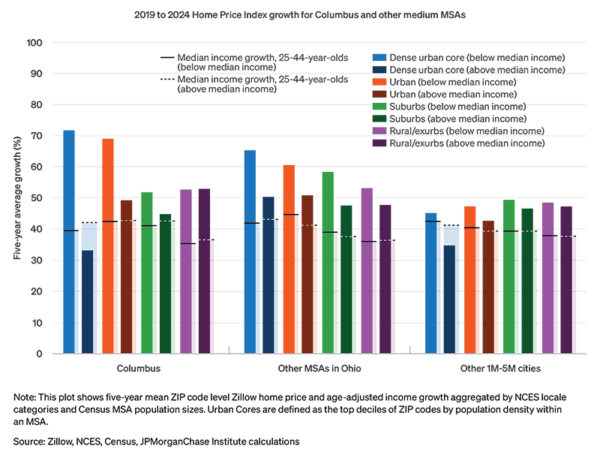
Higher home prices disproportionately affect minority residents in Columbus, making it harder to save for down payments and qualify for credit.
Loan penetration rate helps show whether lending is distributed equitably. By comparing each group’s share of loans to its share of the population, we can see where gaps persist.
Given that non-Hispanic white households represent 73.3% of Columbus households, we would expect a similar share of loans to go to that group. Instead, they received 78.5% of loans in 2024.
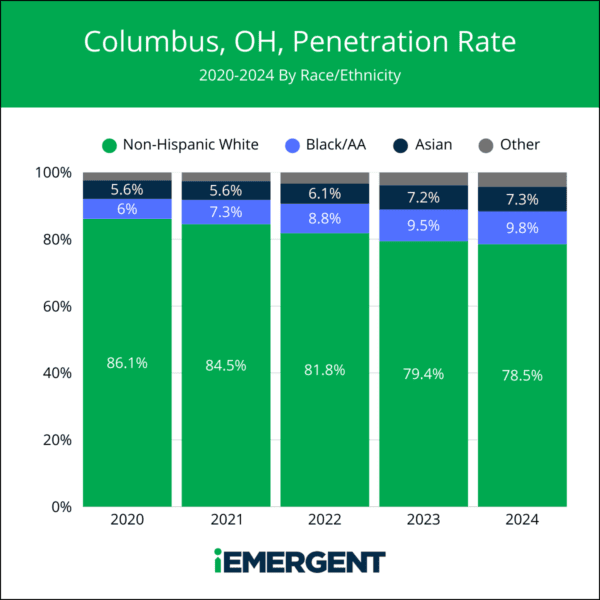
But things are improving. The share of loans originated to Black, Asian, and households of other non-white races has grown from 13.9% in 2020 to 21.5% in 2024. This improvement can be attributed to purposeful lending, driven by individual lenders and by wider initiatives like CONVERGENCE.
LMI, Diverse Lending Intersect
While diverse lending and low-to-moderate income lending are distinct lending goals, there is considerable overlap between them in Columbus. In general, LMI census tracts occupy the same geographic areas where the minority population is higher (see map above compared to the one below).
LMI Census Tracts
LMI tracts are in red; non-LMI tracts are in blue
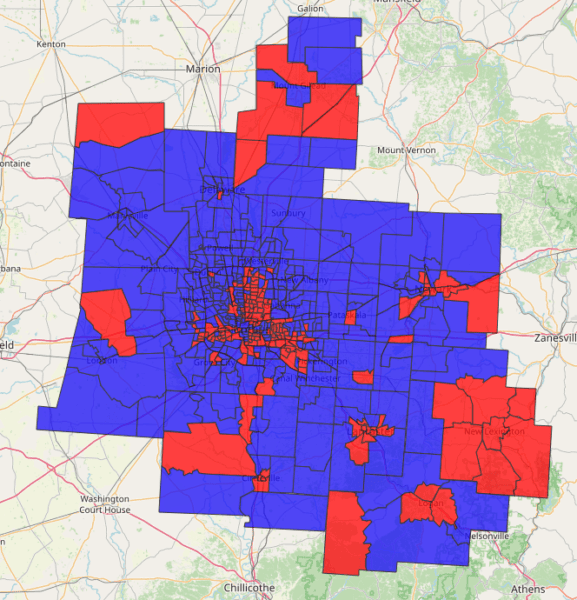
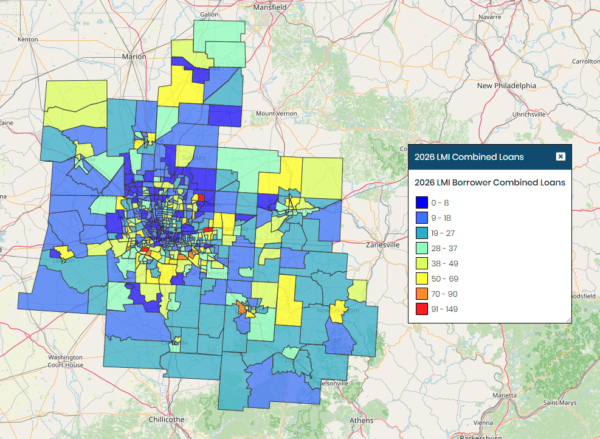
In 2026, lending to LMI borrowers will account for about 18% of loan dollars and 28% of loan count in the market. These loans will be spread throughout the market:
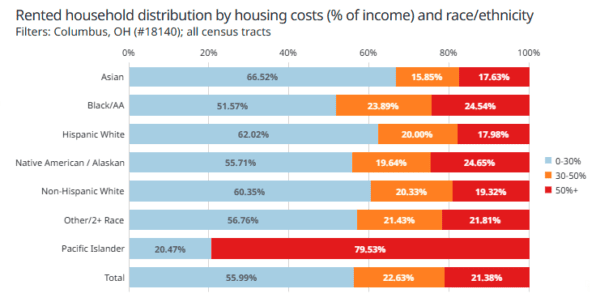
Housing cost burden data in Columbus reflects both the rising cost of living in the region and broader trends in LMI lending. A household is deemed to have a “housing cost burden” if it utilizes 30% or more of its income on housing costs (rent, utilities, mortgage, etc.). Severe housing cost burden occurs when 50% or more of income is used for housing.
Many renters in Columbus face housing cost burdens, but the strain is especially acute for Black households: nearly half are cost burdened, and 24.5% are severely burdened. When so much income goes to housing, saving for closing costs or a down payment becomes far more difficult—one reason neighborhoods with high renter cost burden often have lower homeownership rates.
Turning Insight Into Action
For lenders, Columbus is a market rich with potential: persistent homeownership gaps point to unmet demand and communities eager for access to credit. Lenders that use data to identify and reach these underserved areas can grow their business while making a measurable impact on equity in the market.
iEmergent’s data and tools help lenders in markets like Columbus:
- Pinpoint census tracts where lending is forecast to grow
- Identify gaps in minority and LMI lending
- Develop place-based credit programs and community partnerships
- Recruit and deploy loan officers strategically
- Use forward-looking data to plan with precision
With iEmergent’s data and tools, you can drill in to see where the real, local opportunities lie—and act on them. Want to explore what this looks like in your market? Schedule a demo with iEmergent today.
The information reported in this document, financial and otherwise, should not be construed as either legal or investment advice, nor does it represent the views of ACUMA, its Board of Directors, its staff or its members. The author presents information current at the time of publication and is designed to educate ACUMA members and others interested in the credit union mortgage lending industry.
Author
Related News
September 4, 2026
Top Credit Union Mortgage Originators – 2026 Q1
This content is an exclusive benefit for Association members. If you’re a member, log in and you’ll get immediate access.…

August 13, 2026
Mortgage Momentum, Home Equity Growth: What the Latest Data Reveals
This content is an exclusive benefit for Association members. If you’re a member, log in and you’ll get immediate access.…

July 14, 2026
Home Lending Trends Every Credit Union Should Know
This content is an exclusive benefit for Association members. If you’re a member, log in and you’ll get immediate access.…